 Deutschland - English
- Country
-
 Deutschland
-
 Ireland
 -
 UK
UK
- Language
- Deutsch
- English

- Language
- English
- Language
- English
- Language
- English
 Deutschland - English
 Deutschland
 Ireland
 UK
UK 
Requirements for One Net Business applications
About the dashboard
What you see on the dashboard
Abbreviations shown on the dashboard
Managing issues you see on the dashboard
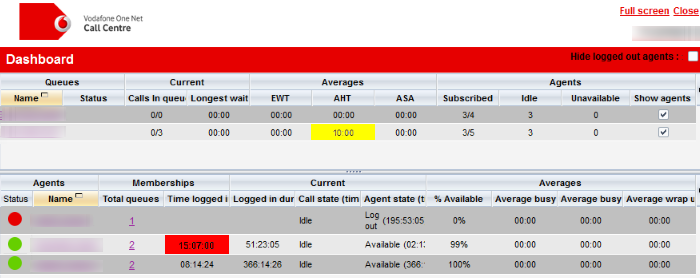
In One Net Call Centre, you can view key performance indicators and other statistical information in real-time on the dashboard. Your administrator configures how often the information is updated. The dashboard can be projected and used as a wallboard.
To view the dashboard, select Dashboard from the top of the screen.
You can see all your organisation's queues and information about all the agents assigned to those queues.
You can choose which columns you see on the Dashboard window.

The top half of the dashboard shows queue statistics and the bottom half shows agent statistics.
To see agent statistics, select or clear the Show agents option for each queue. All the agents subscribed to your selected queues appear in the agent statistics area.
You can select queues and agents on the dashboard, and then perform tasks.
Some statistics might be highlighted red or yellow. This is due to performance thresholds.
Your administrator can configure thresholds for performance statistics. The first threshold is a notification, the second is an alarm. When a number reaches the notification threshold, it turns yellow. When the number reaches the alarm threshold, it turns red.
For example, you might see that the technical support queue is very busy and customers are waiting a longer than normal time. The Longest wait field shows yellow. As the situation gets worse and customers are waiting even longer, the Longest wait field becomes red. You decide to subscribe some extra agents to the queue. Calls are answered more quickly, the waiting time goes down and the colour of the Longest wait field returns to normal.
|
EWT |
Expected waiting time |
The predicted amount of time that calls are in that queue before they are answered. |
|
AHT |
Average handling time |
The average call duration for that queue. |
|
ASA |
Average speed of answer |
The average amount of time that calls are in that queue before they are answered. |
Normally you cannot perform tasks on a queue that you do not monitor. When you select a queue from the dashboard that you aren't monitoring, One Net Call Centre allows you to temporarily monitor the queue so that you can perform urgent tasks.
To manage an issue you see on the dashboard
One Net Call Centre takes you directly to the queue in Queued calls.
One Net Call Centre takes you directly to the agent in > Agents.
Talk to the One Net Business administrator in your company. They understand your system best.
Only for One Net Business administrators: contact us if you have any questions.
Did you find this article useful?
Yes
No
Thanks for your feedback.